
You launched an affiliate program. Sign-ups are trickling in, a few links are getting clicked, and your dashboard is filling up with numbers. Then comes the uncomfortable question: which of these numbers actually means anything?
Most affiliate programs focus on growing affiliate numbers, but that metric alone can be misleading. What really matters is tracking the right affiliate marketing metrics that show performance and revenue.
In this guide, you’ll learn the most important metrics, simple formulas, practical examples, and 2025-2026 benchmarks to measure your program’s success with confidence.
Key Takeaways
- Track fewer metrics, better. A shorter list you actually review beats a giant dashboard you ignore.
- Active affiliate rate matters more than affiliate headcount. Fifty sellers beat five hundred spectators.
- Conversion rate is the heartbeat of a program. For most stores, 1% to 3% from affiliate traffic is a reasonable range.
- Benchmark against your own trend first, the industry second. Your last quarter is the fairest comparison you have.
- Cookie duration quietly rewrites every number on this page. Set it before you judge your results.
- One reporting dashboard beats a folder full of spreadsheets, especially once payouts enter the picture.
Metrics, KPIs, and Benchmarks: Clearing Up the Confusion
People use these three words as if they mean the same thing. They do not, and mixing them up leads to muddy decisions.
A metric is any raw number you can measure: clicks, visits, orders, revenue. It describes what happened, nothing more.
A KPI is a metric you have tied to a goal, which turns it into a scoreboard. “Number of new affiliates” is a metric. “10% month-over-month growth in active affiliates” is a KPI.
A benchmark is an external yardstick, the industry figure against which you hold your own numbers.
Why does the distinction matter?
Because a metric with no goal attached is just trivia, traffic climbed 40% last month. Good news or bad? You cannot say until you know what you were aiming for and what it cost to get there. Pick a handful of metrics, attach goals to make them KPIs, and use benchmarks for context. That is the whole discipline.
This is also where vanity metrics do their damage. Total sign-ups, total impressions, follower counts: they climb, they feel like progress, and they hide the fact that almost nobody is converting. Signal metrics tell you what is working and what needs fixing. Vanity metrics just make you feel busy.
The Core Affiliate Marketing Metrics Worth Tracking
Start here. These four metrics form the foundation of every affiliate program, from day one through year five.
1. Affiliate Funnel Metrics
These metrics show how affiliate traffic moves through your funnel, from clicks and visits to conversions and earnings.

(i) Referred traffic and clicks
The number of visitors your affiliates send to your store over a given period. It is the top of your funnel, the raw fuel everything else runs on.
Track it alongside conversions, never on its own. High traffic with nothing behind it is not a win, it is a warning that the audience or the offer is off. A thousand curious clicks that buy nothing tell you less than a hundred that convert.
(ii) Click-through rate (CTR)
CTR measures how often people click an affiliate link after seeing it.
Formula: (Clicks ÷ Impressions) × 100Example: An affiliate’s banner was shown 5,000 times and earned 150 clicks. That is (150 ÷ 5,000) × 100 = 3% CTR.
A low CTR usually means the placement or the messaging is not pulling people in. A high CTR paired with weak conversions points the finger somewhere else, at your landing page or your offer. Healthy affiliate CTRs often sit in the 0.5% to 1% range, so treat anything above 1% as a good sign.
(iii) Conversion rate
The percentage of affiliate-referred visitors who take the action you want, usually a purchase.
Formula: (Conversions ÷ Affiliate-referred visitors) × 100Example: 1,000 visitors arrived through affiliate links and 30 bought. That is (30 ÷ 1,000) × 100 = 3% conversion rate.
Conversion rate is the number I would look at first if I could only keep one. It is where traffic quality, offer strength, and landing-page experience all meet. According to FirstPageSage, the cross-industry average sits around 1.2%, running near 2.0% for B2C models and 1.2% for B2B. If your affiliate traffic is high but conversions are flat, something upstream is broken.
(iv) Earnings per click (EPC)
EPC tells an affiliate how much they can expect to earn for every click they send you. It is the single number experienced affiliates check before deciding whether your program is worth their time.
Formula: Total affiliate earnings ÷ Total clicksExample: Your affiliates earned $2,000 from 4,000 clicks last month. That is $2,000 ÷ 4,000 = $0.50 EPC. Every click is worth fifty cents to the affiliate.
A strong EPC quietly recruits for you. A weak one quietly pushes good partners toward someone else’s program. Industry data tends to place healthy EPCs somewhere between roughly $0.45 and $1.50, though this swings hard by vertical, so use it as a directional guide rather than a hard target.
2. Revenue and Profitability Metrics
Traffic metrics tell you whether the program is alive. These tell you whether it is worth running.

(i) Average order value (AOV)
How much the average customer spends per order when they arrive through an affiliate link.
Formula: Total affiliate revenue ÷ Number of ordersExample: Affiliates drove $8,000 from 100 orders. That is $8,000 ÷ 100 = $80 AOV.
AOV is your guide for structuring commissions. If affiliate-referred shoppers tend to buy bigger baskets, those affiliates have earned more generous rates. There is also a quality signal buried here: affiliate-referred customers frequently spend more than direct traffic. In one Awin case study, customers referred by affiliates carried a higher average order value than shoppers who came straight to the site.
(ii) Gross vs. net revenue
Gross revenue is everything your affiliate channel brought in. Net revenue is what is left after commissions, refunds, and reversed sales are deducted. The gap between the two is where a lot of programs quietly lose the plot.
Always judge the program on the net. A channel that looks like a machine on gross revenue can barely break even once you subtract what you paid out and what got returned.
(iii) Cost per acquisition (CPA / CAC)
What it costs to win one customer through the affiliate channel.
Formula: Total affiliate program cost ÷ New customers acquiredExample: You spent $1,000 on commissions and tools and gained 25 customers. That is $1,000 ÷ 25 = $40 CPA.
CPA is how you compare affiliates against your other channels on a level field. Put your affiliate CPA next to paid search and email, and you find out fast whether the affiliate is genuinely cheaper or just feels that way. A rising CPA is a nudge to review your commission structure or the quality of partners you are onboarding.
(iv) Return on investment (ROI)
The metric that ends the “is this even worth it” argument.
Formula: (Affiliate revenue − Affiliate cost) ÷ Affiliate cost × 100Example: The program brought in $5,000 and cost $1,000 to run. That is ($5,000 − $1,000) ÷ $1,000 × 100 = 400% ROI. Four dollars back for every one spent.
Affiliate tends to return well against other channels precisely because you pay for outcomes, not impressions. A widely cited figure from Rakuten Advertising puts the return around $12 for every $1 spent, though your own number is the only one that pays your bills, so calculate it and watch the trend.
(v) Customer lifetime value (CLV)
The total revenue you can expect from one customer across the whole relationship.
Formula: (Average purchase value × Purchase frequency) × Average customer lifespanExample: Affiliate-referred customers spend $50, buy three times a year, and stay two years. That is ($50 × 3) × 2 = $300 CLV.
CLV is what keeps a healthy-looking program from being secretly fragile. If affiliates bring buyers who purchase once and vanish, the topline flatters you while the foundation crumbles. Comparing the CLV of affiliate-referred customers against customers from other channels is one of the sharpest ways to measure the real quality of your partners.
(vi) Reversal/return rate
How often affiliate-driven purchases get returned, refunded, or cancelled.
Watch this per affiliate, not just program-wide. A single partner with a high return rate is a red flag. It can signal misleading promotion, an audience mismatch, or, in the worst case, fraud. One bad actor can drag your net revenue down while your gross numbers keep smiling.
3. Affiliate Program Health Metrics
These four answer a different question: not “how much are we selling” but “is this program actually healthy underneath?”

(i) Active affiliate rate
The share of your affiliates who are actually doing something.
Formula: (Active affiliates ÷ Total affiliates) × 100Example: 200 affiliates signed up, 60 are sharing links. That is (60 ÷ 200) × 100 = 30% active rate.
This is the antidote to vanity headcount. Most programs run a surprisingly low active rate, so anything above 30% is solid. If yours is lower, the problem is rarely recruitment. It is onboarding or your commission offer.
(ii) Revenue per active affiliate
Average revenue generated by each affiliate who is actually working.
Formula: Total affiliate revenue ÷ Active affiliatesExample: $15,000 in revenue across 30 active affiliates. That is $15,000 ÷ 30 = $500 per active affiliate.
Use it to spot your stars and your passengers. If this number falls even as your affiliate count grows, your recruits are underperforming your existing base, which changes how you spend your recruitment energy.
(iii) Top-affiliate revenue concentration
The share of revenue coming from your very best partners. In plenty of programs a small handful of affiliates drive the overwhelming majority of sales.
Some concentration is normal. Heavy concentration is a risk. If one affiliate is responsible for most of your revenue and they walk, so does your program. Track this so dependency does not sneak up on you.
(vi) Incremental revenue
The honest one. This is the revenue your program generated that would not have existed without it.
How to track it: Compare revenue during affiliate promotion periods against baseline periods with no affiliate activity.
Incremental revenue answers the question most programs are afraid to ask: Would we have made these sales anyway? A coupon affiliate who only ever catches customers already at checkout may be adding less than the raw numbers suggest. This metric is harder to pin down than the rest, but it is the closest thing you have to the truth about your channel’s real contribution.
Which Affiliate Marketing Metrics Matter at Each Stage
Not every metric deserves your attention at once. The numbers you obsess over at launch are not the ones that matter at scale. Here is a rough map.
| Stage | What are you asking | Metrics to watch |
| Launch | Is anyone interested? Are affiliates showing up? | Active affiliate rate, referred traffic, and CTR |
| Growth | Are they actually driving results? | Conversion rate, EPC, revenue per active affiliate |
| Maturity | Is this profitable and durable? | CLV, CPA, ROI, reversal rate, incremental revenue |
Early on, you are validating. You want proof that people will sign up and share. As the program grows, the question shifts from participation to performance, so conversion rate and EPC move to the front. Once things are established, profitability and quality take over, and metrics like CLV and ROI decide whether you scale or rethink.
Affiliate Marketing Benchmarks for 2025 and 2026
Benchmarks give you context, but read them with a raised eyebrow. Affiliate income data in particular is the most inflated category in the industry, because most published figures come from surveys of active marketers and quietly exclude the majority who earn little. Treat these as directional, and for a wider set of current figures, our roundup of affiliate marketing statistics goes deeper.
| Metric | Rough benchmark | Source |
| Conversion rate (all industries) | ~1.2% average; ~2.0% B2C, ~1.2% B2B | FirstPageSage |
| Click-through rate | ~0.5% to 1% | Awin |
| Earnings per click | ~$0.45 to $1.50 (directional, varies by vertical) | Network data |
| Return on ad spend | ~$12 per $1 spent | Rakuten Advertising |
| Share of US ecommerce orders | ~16% | eMarketer |
Two cautions. First, a single “industry average” hides enormous variation between verticals. A finance program and a low-ticket ecommerce store live in different universes, and comparing yourself to a blended average tells you almost nothing.
Second, your own historical trend is a fairer benchmark than any of these. If your conversion rate climbed from 1.4% to 1.9% this quarter, that is real progress regardless of where the industry sits.
The Metrics WooCommerce Store Owners Should Prioritise
Generic affiliate advice glosses over the things that actually shape a WooCommerce store’s numbers. A few deserve special attention.
i. Attribution and cookie duration: This is the setting most owners overlook, and it silently changes every metric on this page. Cookie duration is how long after a click a sale still counts for the affiliate. Set it too short, and your product’s real buying cycle outlasts the window, so legitimate referrals go uncredited, and your conversion rate looks worse than it is. Set it too long and you credit affiliates for sales they barely influenced.
Most programs land on a 30-day window as a sensible default, but the right number depends on how long your customers actually take to decide. WC Affiliate lets you set your own cookie duration, and its WooCommerce affiliate tracking methods give you the control you want before you start judging results.

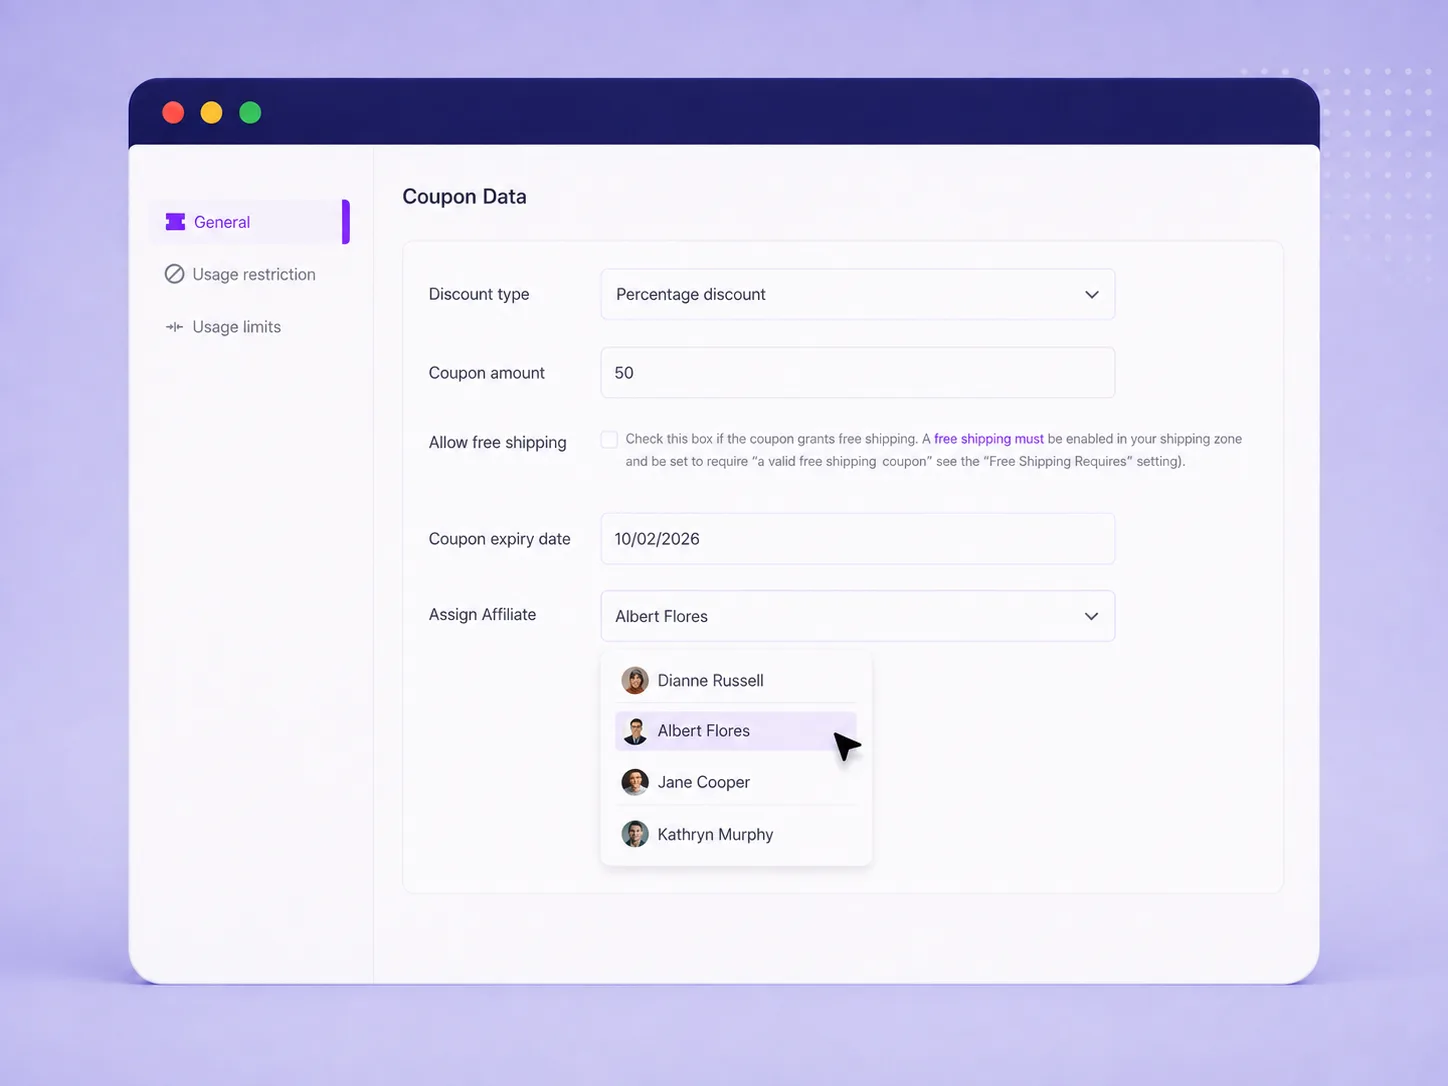
ii. Coupon-based tracking: Some affiliates share codes, not links. If you only measure link clicks, you are blind to a whole slice of your channel. Coupon-based affiliate tracking attributes a sale through a unique code, so influencers and creators who work by code instead of link still show up in your numbers.
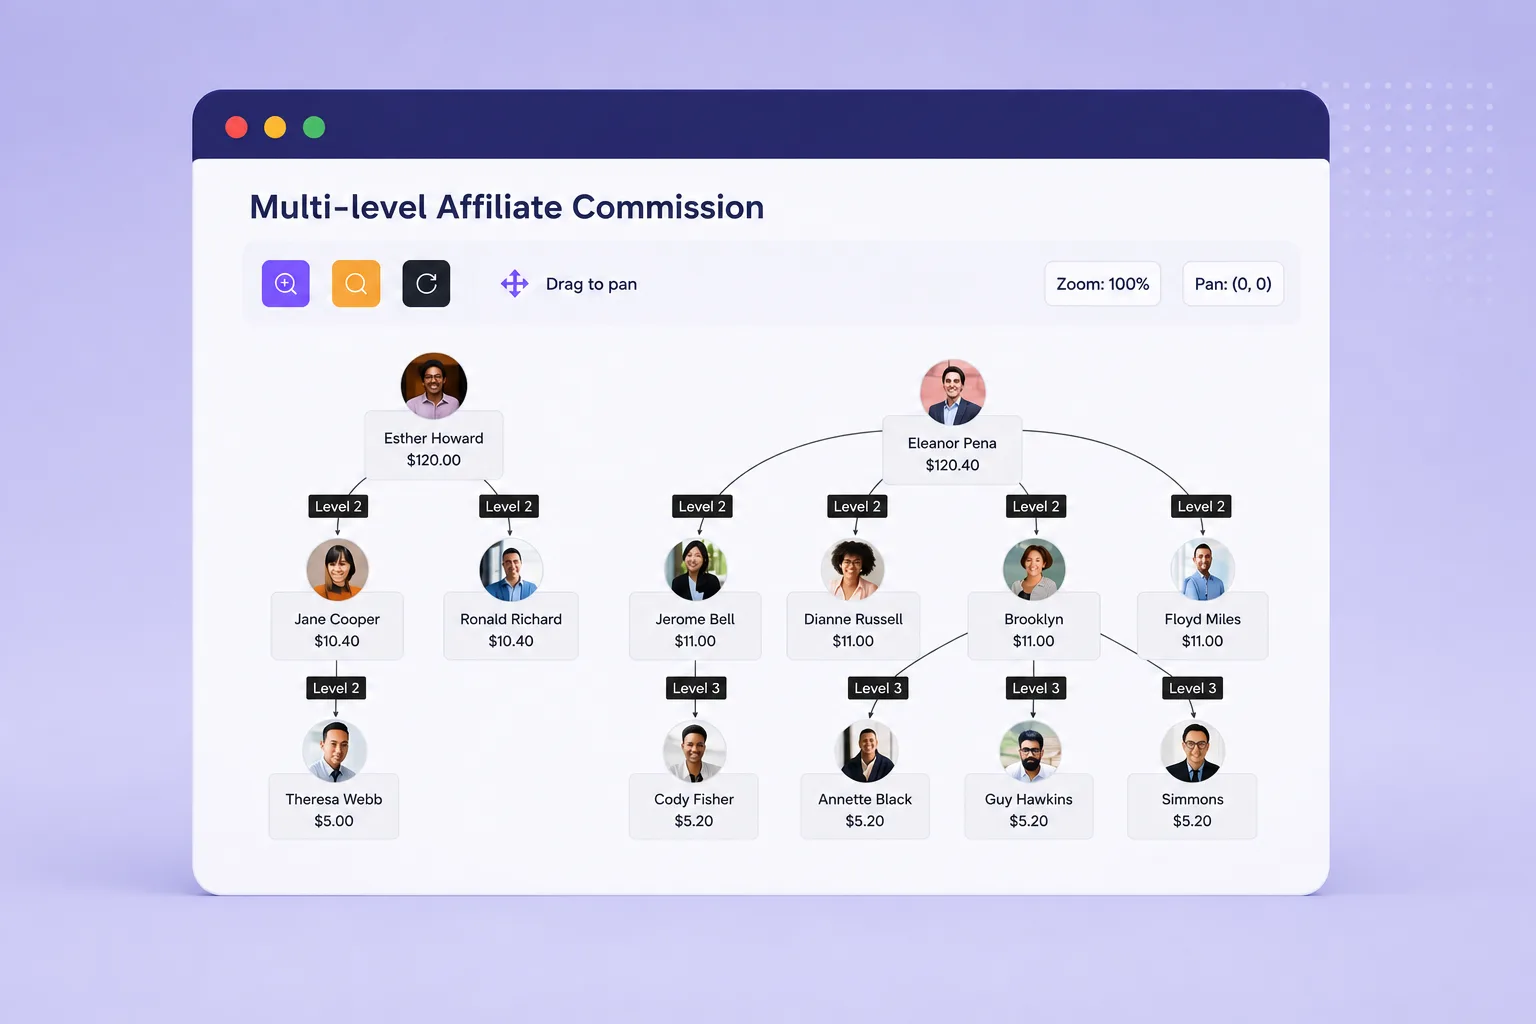
iii. Multi-level contribution: If your program rewards affiliates for recruiting sub-affiliates, you need to measure both direct and sub-affiliate sales to see the full picture. Multi-level commissions can widen your reach, but only if your reporting separates who sold directly from who brought in the seller.
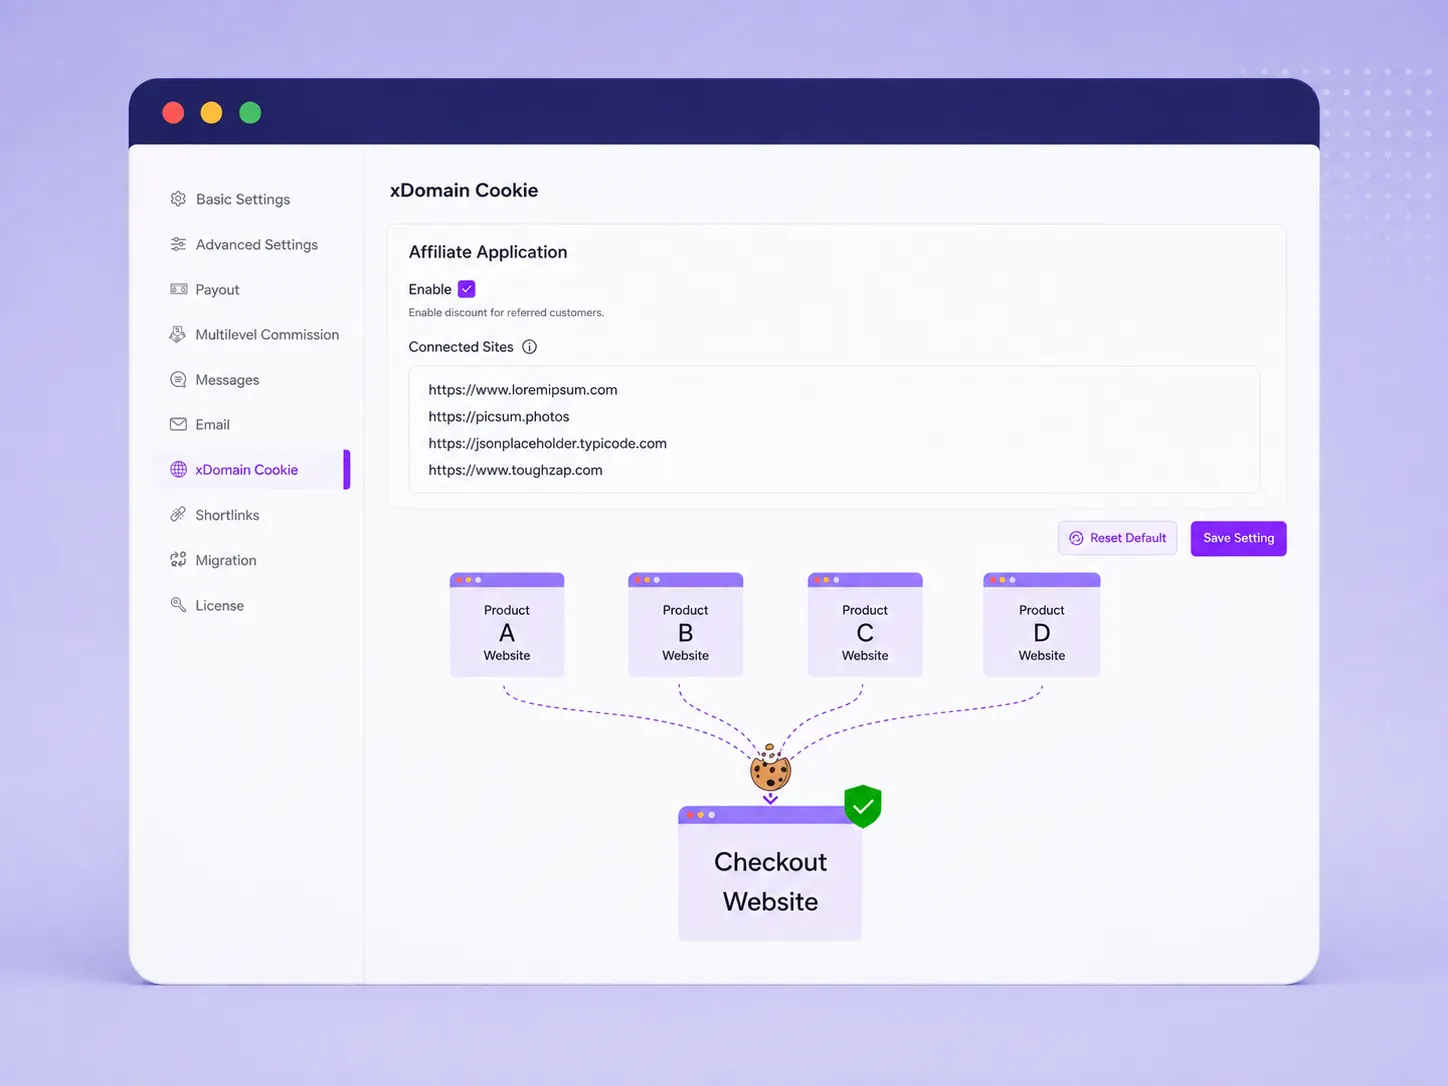
iv. Cross-domain tracking: Running more than one store across multiple domains? Referrals need to follow the customer across them, or your attribution breaks at the domain boundary, and your best affiliates lose credit.
Turn Affiliate Metrics Into Your Decisions
Tracking is the easy part. Acting on what you see is where most programs stall. A simple working rhythm helps.
Anchor every metric to a goal before you measure it. A number with no target attached is just something to stare at. Decide what success looks like this quarter, then track the metrics that map to it.
Segment before you average. Program-wide averages hide the interesting parts. Break your numbers down by individual affiliate, by product, and by traffic source, and the patterns you actually need jump out. Your average conversion rate might be fine while one traffic source is quietly dragging everyone down.
Benchmark against yourself first. Industry figures are a useful backdrop, but the comparison that matters most is your own last month. Are you improving? That question outranks almost everything else.
Investigate a drop before you assume the cause. If conversions fall, resist the urge to blame the obvious suspect. It could be a landing-page change, an audience mismatch, or plain seasonality. Dig, then decide.
How to Track Your Affiliate Marketing Metrics Without Spreadsheet Chaos
Here is the reality of tracking all this by hand. You pull clicks from one place, conversions from another, commissions from a third, and payouts from a spreadsheet you are terrified to touch. Numbers drift out of sync, and by the time you have reconciled them, the moment to act has passed.
A single source of truth fixes that. What you want is one view that shows visits, referrals, transactions, and per-affiliate performance together, updating on its own. That is where a purpose-built dashboard earns its keep.
WC Affiliate brings these numbers into a dedicated affiliate dashboard inside your WordPress admin. That means you have visits, affiliates, referrals, and transactions, with graph and chart views for a fast read on program health and CSV export when you need the raw data.
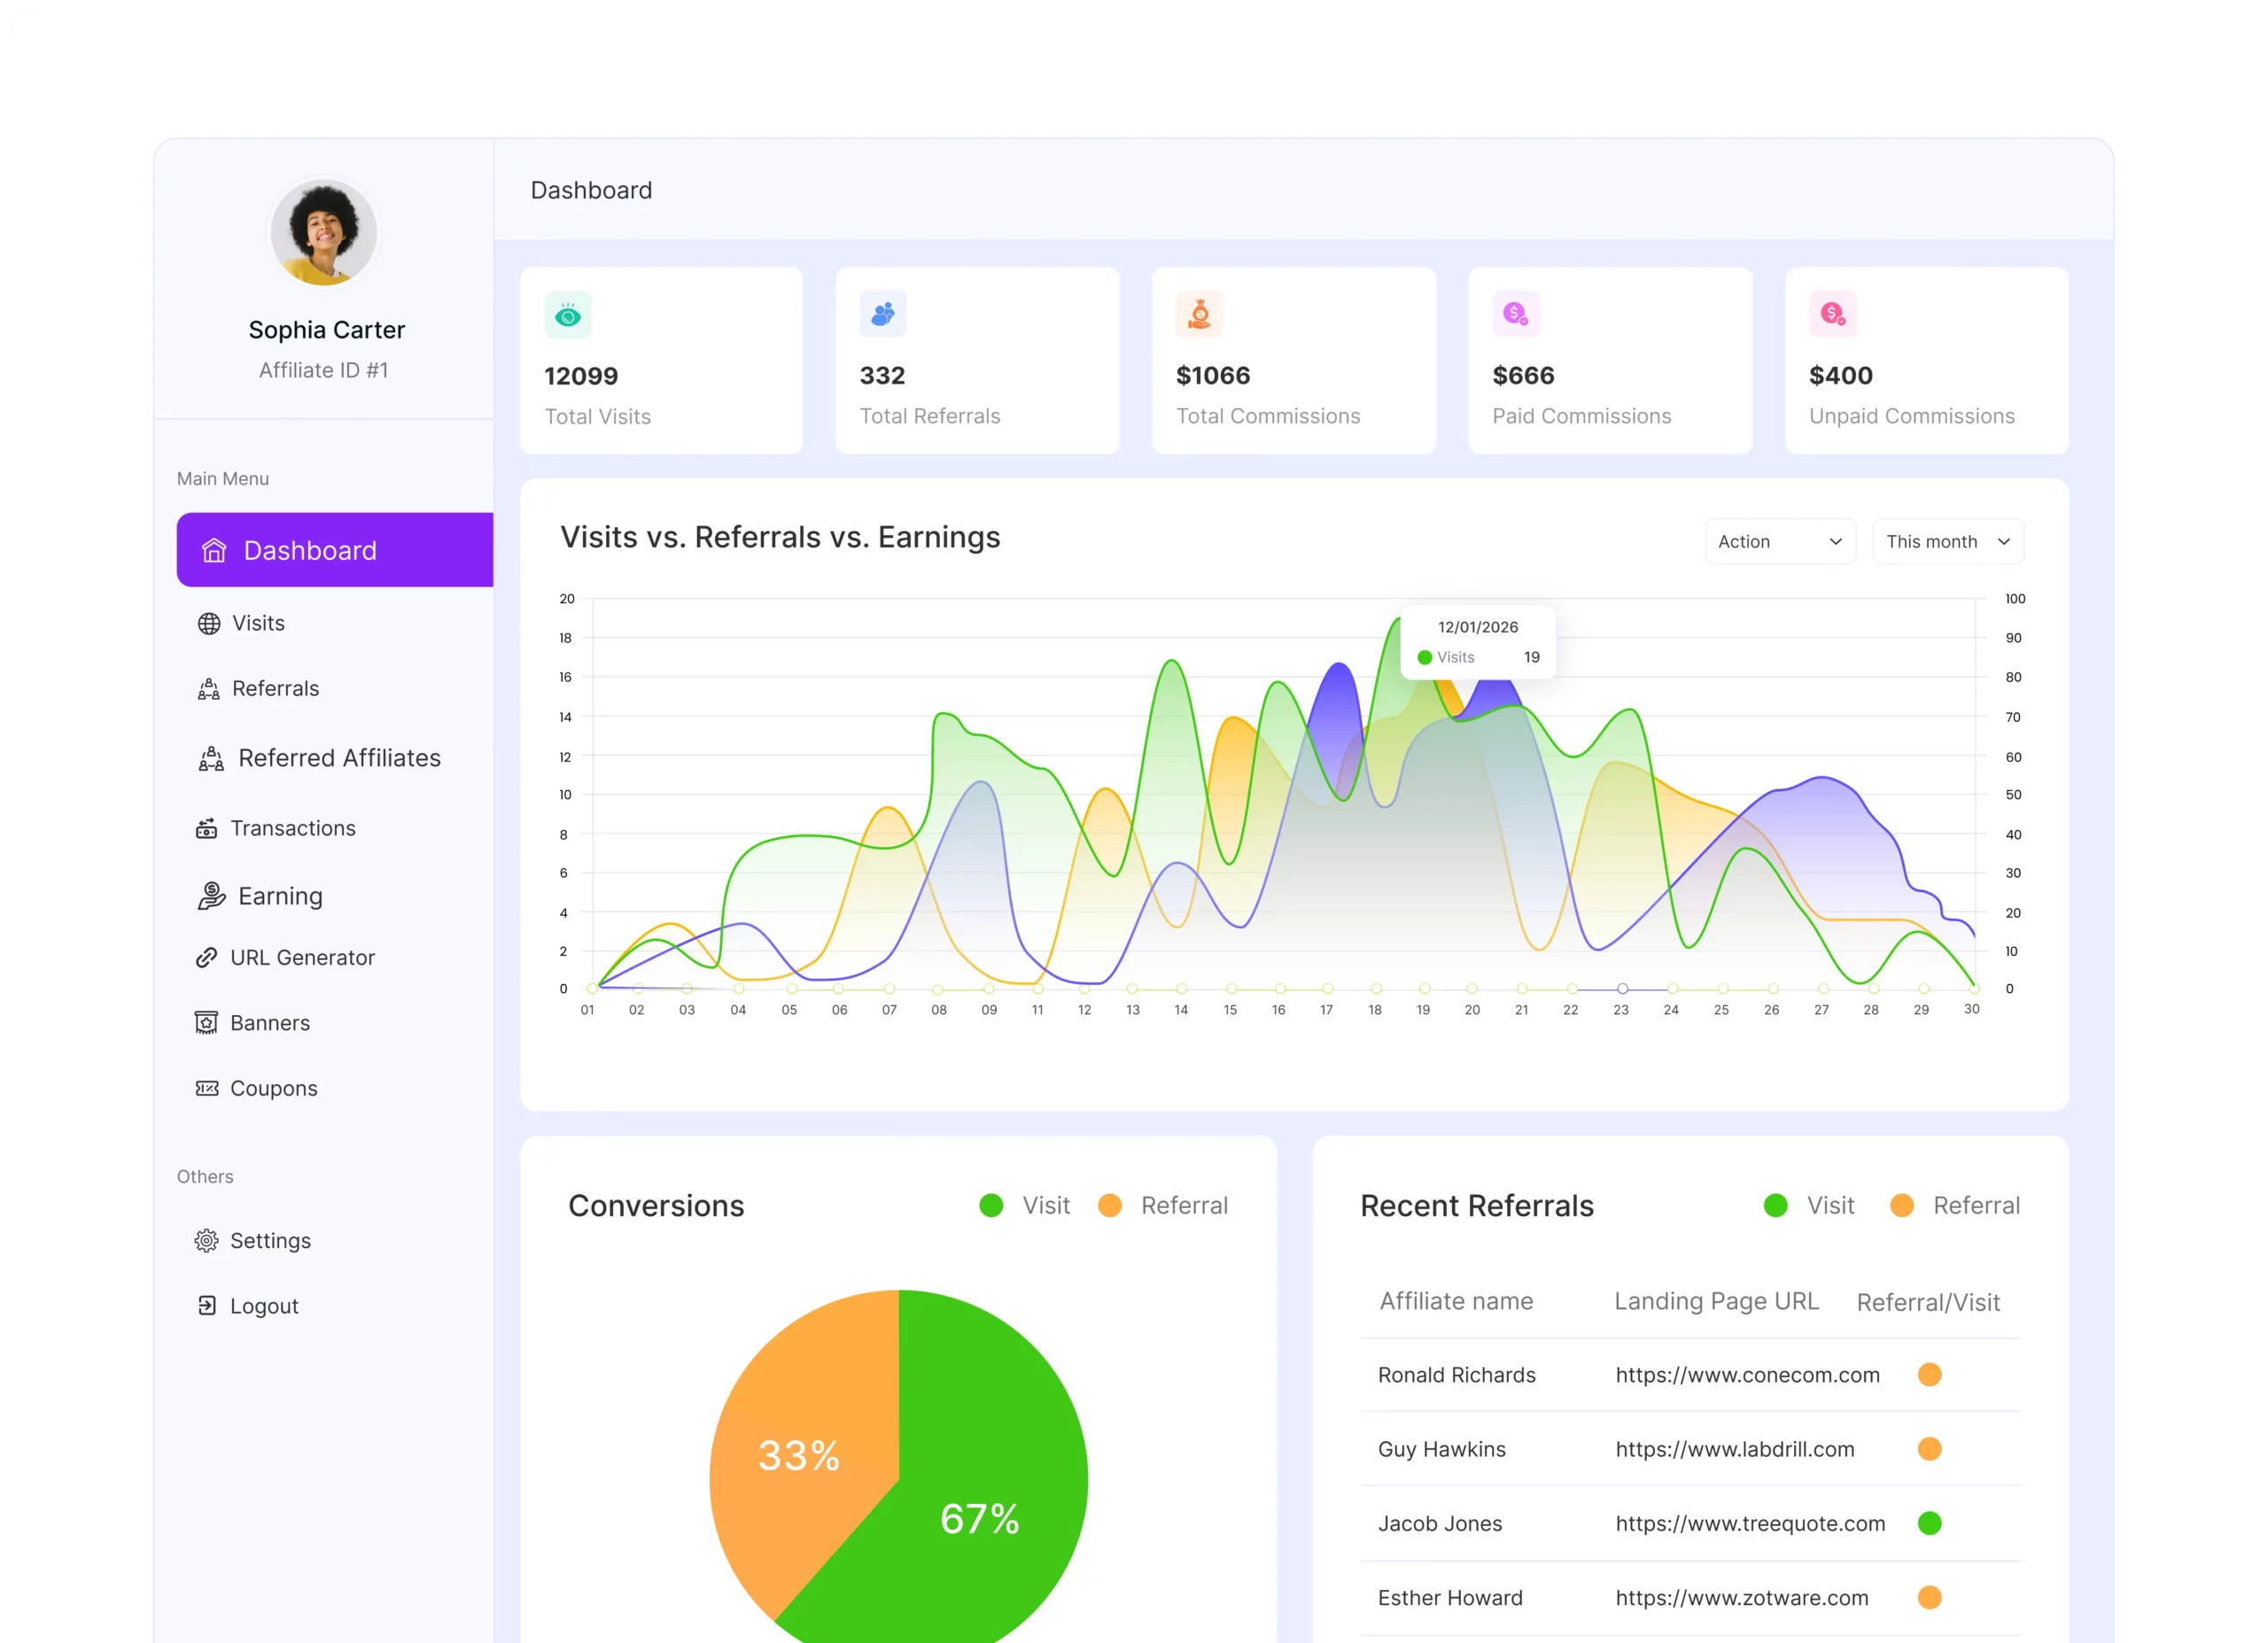
Every payout is logged automatically with amount, method, date, and affiliate name, so your financial picture stays clean without manual bookkeeping.
When the tracking runs in the background on every click, you spend your time deciding what to do about the numbers instead of assembling them.
Conclusion
The programs that win are not the ones tracking the most metrics. They are the ones tracking the right few and acting on them. Keep a short list you actually review. Benchmark against your own last quarter before you worry about the industry.
And remember that measurement only helps when every number resides in one place, instead of being scattered across tabs.
If your affiliate data is currently scattered across spreadsheets and based on guesswork, that is the first thing to address. WC Affiliate puts your visits, referrals, transactions, and payouts into one real-time view inside WordPress.
Start with the free WC Affiliate plugin, pick the two or three metrics that map to this quarter’s goal, and let the numbers decide where your program goes next.
Frequently Asked Questions
Conversion rate, in most cases, because it reflects traffic quality, offer strength, and landing-page experience all at once. The exception is your stage: active affiliate rate leads at launch, while ROI and CLV take over at maturity.
For most stores, 1% to 3% from affiliate traffic is reasonable, with the cross-industry average near 1.2%. B2C runs higher than B2B, so compare against your own vertical and trend rather than a universal number.
EPC is what the affiliate earns per click; CPA is what you spend to acquire one customer. EPC helps you attract and keep good affiliates, while CPA tells you whether the channel is efficient versus your other marketing.
It sets how long after a click a sale still counts for the affiliate, so it quietly shapes your conversion and earnings numbers. Too short drops legitimate late sales; too long credits affiliates for sales they barely influenced. Match the window to how long your customers take to buy.